
I had designed and developed a web apps that run on top of ganglia with few enhanced features as below.
- Process and save ganglia gmetad xml file to relational database
- API and hook to process user defined data in gmetad XML
- Event triggering and configuration
- Threshold configuration
- Job monitoring and statistic
- New UI and data presentation to give new better overview of resource status
- Data mining and report generation
- User authentication and authorization
Following are few screen shots for the monitoring tool
|
| Eagle Eye view - For management and show case |
 |
| Eagle eye view - 2nd level view for each graph |
 |
| Threshold and event triggering control panel |
 |
| Event panel with multiple events acknowledgment. Three severity and number of recurring. |
 |
| Event detail with double click on event at panel |
 |
| Tree view using lazy loading. Three level grid, cluster and node. |
 |
| Hot Spot view that able user to group multiple cluster within hot spot. |
 |
| Ganglia View - summary of grid and cluster |
 |
| Ganglia View - cluster level summary |
 |
| Ganglia View - Node level detail view. |
 |
| Assorted report panel. |
 |
| Snapshot Report available for each three level. |
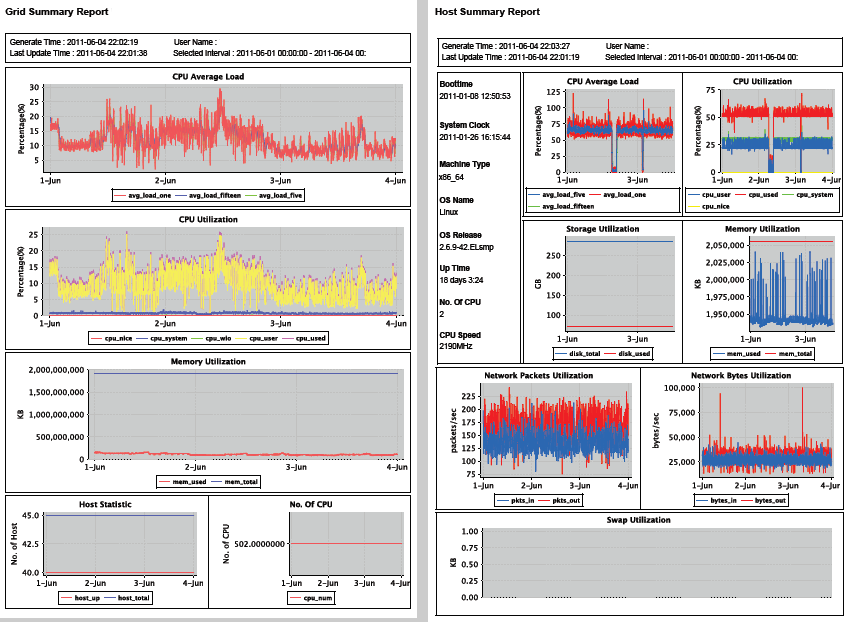 |
| Summary Report available for each three level. |
 |
| User's Job Accounting Report |
 |
| Job Summary Report |
No comments:
Post a Comment